InfoGraphic Tools
- Canva
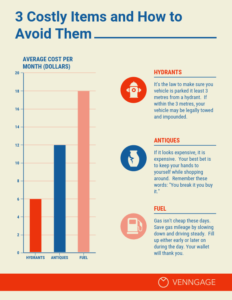
- Venngage
- Piktochart
- Easel.ly
- Google Chart
- Visme
- Visualize.Me (Visualize)
- Infogr.am
- PowerPoint (Free templates below)
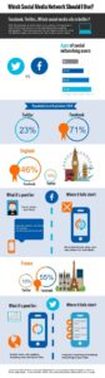
- What About Me
- iChart
- Gliffy
- Creately
InfoGraphic Tools Descriptions
|
1. Canva
Canva provides many different templates for you to pick from including Twitter posts, Facebook posts, Tumblr banners and many more--including infographics. Canva's a powerful and easy-to-use online tool that's suitable for all manner of design tasks, from brochures to presentations and much more besides, with a vast library of images, icons, fonts and features to choose from. can drag and drop images! And it features a dedicated infographic maker that you can use for free, with hundreds of free design elements and fonts at your fingertips, and many more premium elements that you can buy for up to $1. You can either use it in the browser or download the Canva iPad app to design on the move. |
|
|
|
|
2. Venngage
Within the infographic section, you will also find additional options to pick from that tend to deal with particular topics and categories of infographics, like:
Looking for an easy-to-use tool? Venngage is your best bet!Venngage is a great tool for creating and publishing infographics because it's so simple and easy to use. You can choose from templates, themes, and hundreds of charts and icons as well as uploading your own images and backgrounds, or customize a theme to suit your brand. You can animate them too! |
|
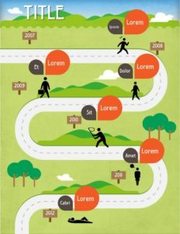
3. Piktochart
You can then either create your own infographic from scratch or select one of their templates (some are free and others require you to either have a Lite or Pro plan). Here’s a sample of some of the Piktochart templates: Piktochart is an infographic and presentation tool enabling you to turn boring data into engaging infographics with just a few clicks. Piktochart's customizable editor lets you do things like modify colour schemes and fonts, insert pre-loaded graphics and upload basic shapes and images. Its grid lined templates also make it easy to align graphical elements and resize images proportionally. There's a free version offering three basic themes, while a pro account costs $29 per month or $169 for a year. 
|

|
|
|
4. easel.ly
Price: Free or Pro Account starting at $3/month Ease of Use: Easy easel.ly makes it really easy for you to create infographics. When you arrive on their main page, all you need to do is either pick one of the many templates they offer or “Start Fresh.” They also offer a way for you to search their template library by category. Here’s a sample of some of the easel.ly templates: Once you have found a template you like (or even when you start from scratch), you will be directed to a new window where you will be able to customize your infographic however you want. easel.ly provides a variety of tools such as backgrounds, shapes, text, charts, and more. You get access to a library of things like arrows, shapes and connector lines, and you can customize the text with range of fonts, colours, text styles and sizes. The tool also lets you upload your graphics and position them with one touch. |
|
|

|
|
|
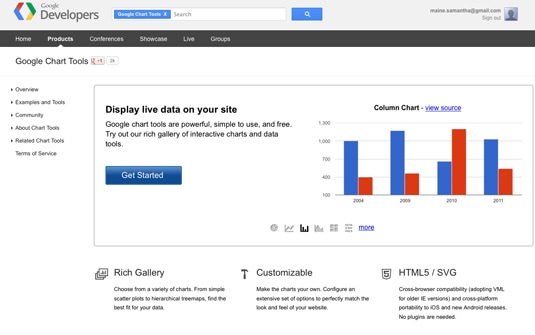
5. Google Chart
Display real live data with Google DevelopersGoogle chart tools are powerful, simple to use, and free. You can choose from a variety of charts and configure an extensive set of options to perfectly match the look and feel of your website. By connecting your data in real time, Google Developers is the perfect infographic generator for your website. |
|
|
6. Visme
Price: Free or Upgrade starting at $7/month Ease of Use: Easy Visme is a new service that is still in beta according to their website. It allows you to create presentations, animations, mock-ups, banners and of course infographics. Once you login with your account, you will be greeted with a visual of all your projects (the space will be empty if you haven’t created any projects yet). You can click on “Create New Visme” to get started. Then it’s time to pick the type of project you would like to create. We of course would be the “Infographic” tab. You will notice that some of the templates are free to use and others require a premium account. You will then be able to customize your infographic however you like with a variety of tools. Visme even allows you to animate objects, although I personally haven’t really played around with that feature. |
|
|
|
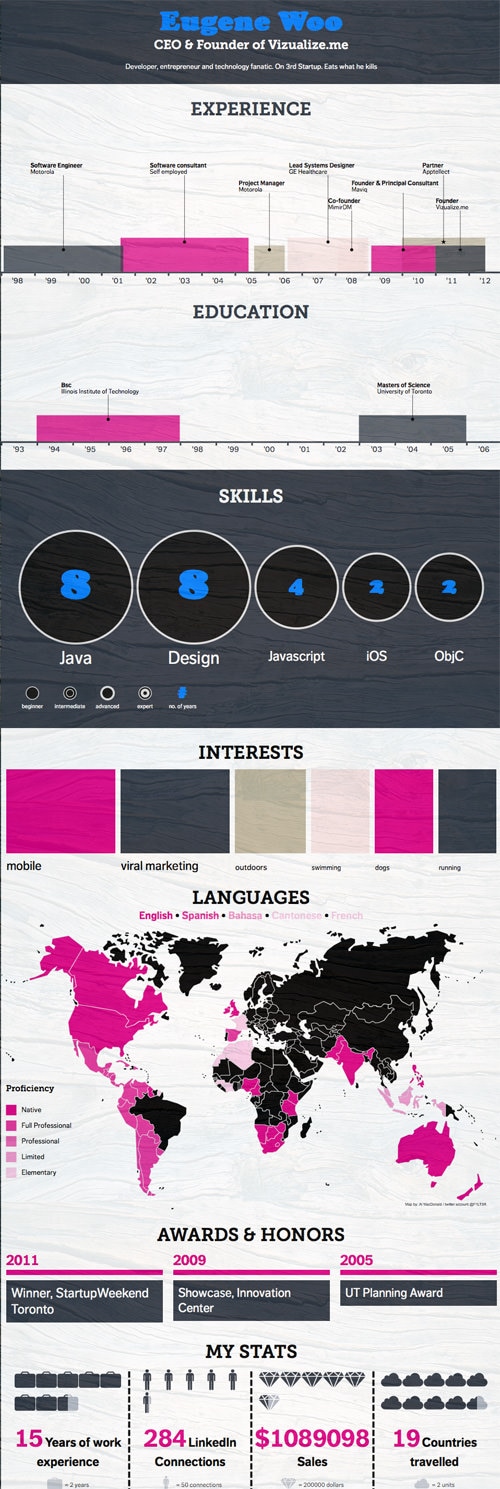
7. Visualize.me
Price: Free Visualize.me is a different type of infographic, they help you create an “infographic resume.” Once you login, you can start creating your resume. You can even connect to LinkedIn to populate some of the information automatically. On the left you will be able to input your information as well as pick the theme for your infographic resume. Here is an example of a template and some very basic information I filled out: After the success of our post on an infographic resume, it was only a matter of time before this infographic resume generator turned up. You can visualise your resume in one click and also take a look at previous examples. Enabling people to express their professional accomplishments in a simple yet compelling personal visualisation, we think this is the start of something big. |
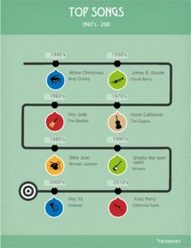
8. infogr.am
Price: Free or Upgrade available starting at $15/month
Ease of Use: Intermediate
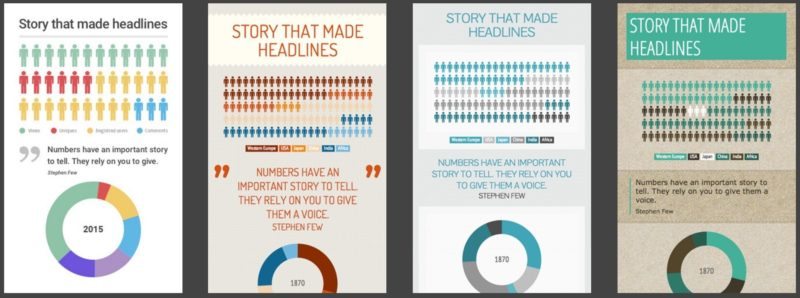
Takes a little longer than some of the ones previously mentioned. infogr.am offers simpler infographic templates for you to use. Here are some of the templates they offer:Once you have picked the template, you can edit the elements on the page. infogr.am is a good option when dealing with statistics. I personally found it a bit harder to use than some of the other options mentioned on this list.
Customising the data that makes up the infographic takes place in an Excel style spreadsheetInfogr.am is a great free tool which offers access to a wide variety of graphs, charts and maps as well as the ability to upload pictures and videos to create cool infographics.
Customising the data that makes up the infographic takes place in an Excel style spreadsheet and can easily be edited, watching the software automatically change the look of the infographic to perfectly represent your data. When you're happy with your infographic you can publish it to the Infogram website for all to enjoy and even embed it in to your own website or share it via social media.
Price: Free or Upgrade available starting at $15/month
Ease of Use: Intermediate
Takes a little longer than some of the ones previously mentioned. infogr.am offers simpler infographic templates for you to use. Here are some of the templates they offer:Once you have picked the template, you can edit the elements on the page. infogr.am is a good option when dealing with statistics. I personally found it a bit harder to use than some of the other options mentioned on this list.
Customising the data that makes up the infographic takes place in an Excel style spreadsheetInfogr.am is a great free tool which offers access to a wide variety of graphs, charts and maps as well as the ability to upload pictures and videos to create cool infographics.
Customising the data that makes up the infographic takes place in an Excel style spreadsheet and can easily be edited, watching the software automatically change the look of the infographic to perfectly represent your data. When you're happy with your infographic you can publish it to the Infogram website for all to enjoy and even embed it in to your own website or share it via social media.
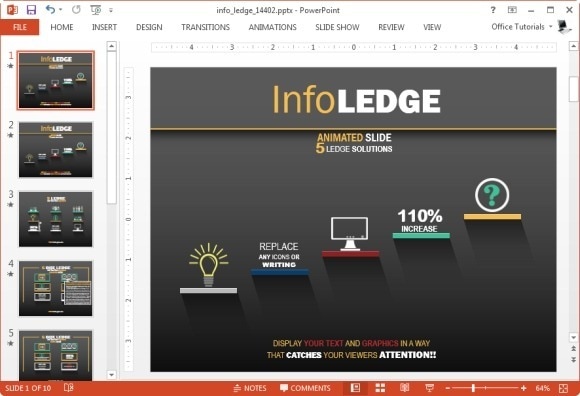
9. PowerPoint - Free Templates
You can create templates on Powerpoint with patience or try a free template at Websites like fppt.com or on Presenter Media
You can create templates on Powerpoint with patience or try a free template at Websites like fppt.com or on Presenter Media
|

|
|
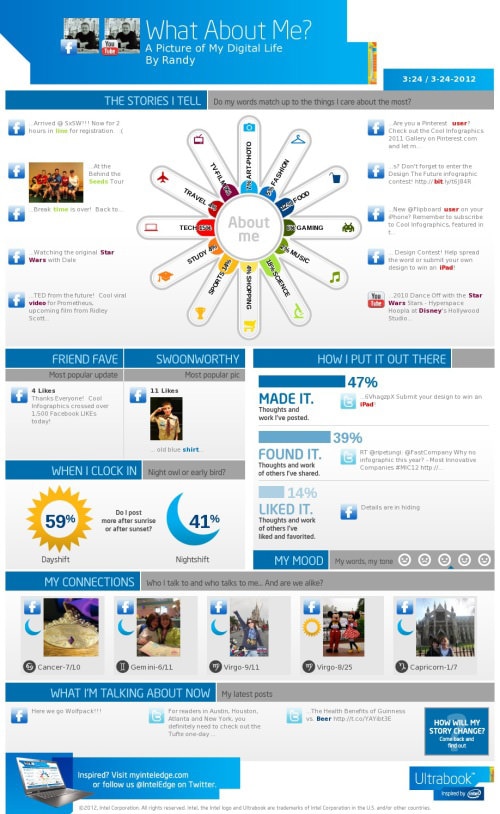
10. What About Me
“What About Me?” is a personalization tool that produces colorful infographics that display your social media habits automatically from Facebook, Twitter and YouTube. The tool is provided by Intel. Create an infographic of your digital life and become inspired by the people you know, the things you see, and the experiences you have online. |
|
11. iCharts
Price: Free or Upgrade or purchase individual images Ease of Use: Easy With iCharts, you can create great-looking charts in minutes with interactive and easy-to-share data. iCharts makes it easy to visualize, share and distribute big and small data. |

|
12. Gliffy
Price: Free Trial or Upgrade starting at $7.99/month
Ease of Use: Easy
Gliffy helps to easily create professional-quality flowcharts, diagrams, floor plans, technical drawings, and more. You can easily drag-and-drop your way through the makings of an infographic using the many shapes from an extensive library.
|
13. Creately
Price: Free or Upgrade starting at $5/month Ease of Use: Easy Want to create beautiful diagrams in no time? Creately may be a good choice to use as it can be used across all sectors by individuals, corporate teams, developers, software architects, students and teachers alike for diagramming purposes. Lots of templates and a bank of images are available. |
|
